Regional climate modelling of European summer heatwaves
A record-breaking heatwave affected the European continent in summer 2003, causing between 20,000 and 35,000 deaths and large financial loss due to crop shortfall and forest fires. Here we use the regional climate model CHRM to identify key physical processes and feedbacks that contributed to the occurrence and persistence of this heatwave. In particular, we investigate the role of the synoptic-scale circulation, soil hydrology and evapotranspiration, as well as related feedback processes for this particular event. Sensitivity experiments are performed by perturbing spring soil moisture in order to determine its influence on the formation of the heatwave. The simulations are driven by lateral boundary conditions and sea-surface temperatures from the ECMWF operational analysis. A multi-year regional climate simulation for 1960–2000, reanalysis data (ERA-40) and independent observations are used for validation.
The exceptionally high temperatures in summer 2003 were initiated by anticyclonic atmospheric circulation enabling a dominance of the local heat balance over Europe . The extremely strong radiative anomalies resulted in a first temperature maximum in June 2003. This surface temperature anomaly consequently contributed to a rapid loss of soil water, which exceeded the multi-year average by far. The lack of moisture resulted in negative latent and positive sensible heat flux anomalies culminating in the maximum heatwave in August 2003. The evaluation of the experiments with perturbed spring soil water shows that this quantity is an important parameter for the evolution of summer climate, but that it played nonetheless a secondary role in the case of the 2003 heatwave.
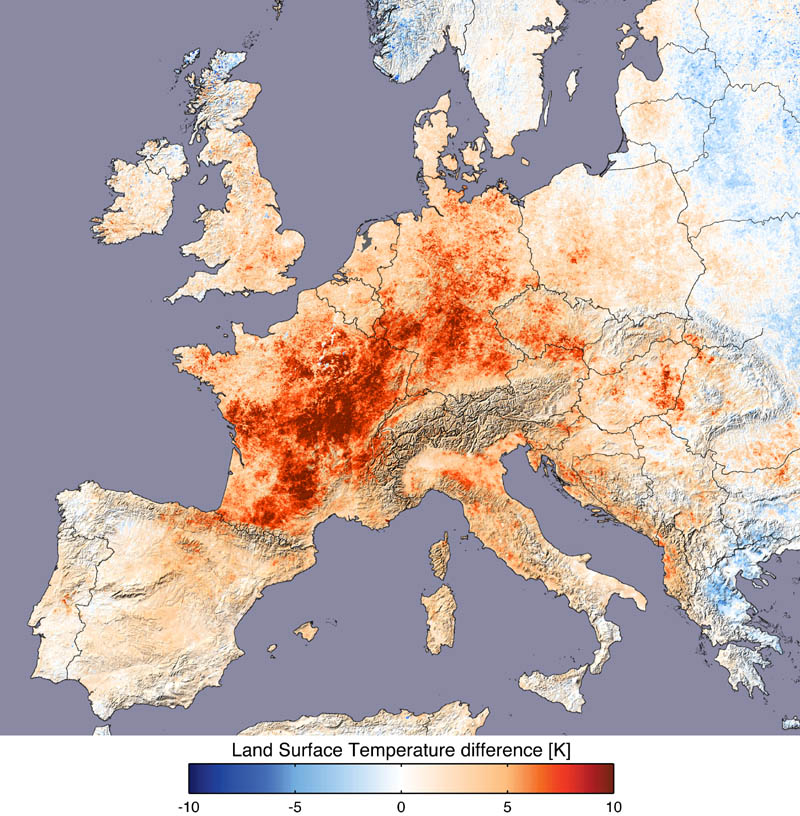
The visualization displays TERRA MODIS (MODerate resolution Imaging Spectroradiometer) derived land surface temperature data of 1km spatial resolution. The difference in land surface temperature is calculated by subtracting the average of all cloud free data during 2000, 2001, 2002 and 2004 from the ones in measured in 2003, covering the date range of July 20 - August 20. (Image by Reto Stöckli, Robert Simmon and David Herring, NASA Earth Observatory, based on data from the MODIS land team). |