StratoClim
Balloon soundings at the southern slopes of the Himalayas
Project description
We participated in the mulit-partner project StratoClim, which aimed at improving the understanding of the chemical and dynamical processes that determine the composition of the upper troposphere - lower stratosphere (UTLS), such as the formation and transport of ozone, aerosols, water vapor and clouds, with focus on the Asian summer monsoon anticyclone (ASMA) region. The ASMA is a major meteorological system of the global upper troposphere-lower stratosphere (UTLS) during boreal summer, and it represents a potentially very efficient pathway for the transport of water vapor, aerosols and anthropogenic pollutants to the stratosphere [e.g. external pagePan et al., 2016; external pagePloeger et al., 2017].
StratoClim (2013-2019) is a project of the European Community’s Seventh Framework Program, involving several universities and research institutes in Europe and associated partners in Asia and the USA. (For the webpage of the international EC Project stee external pagehere).
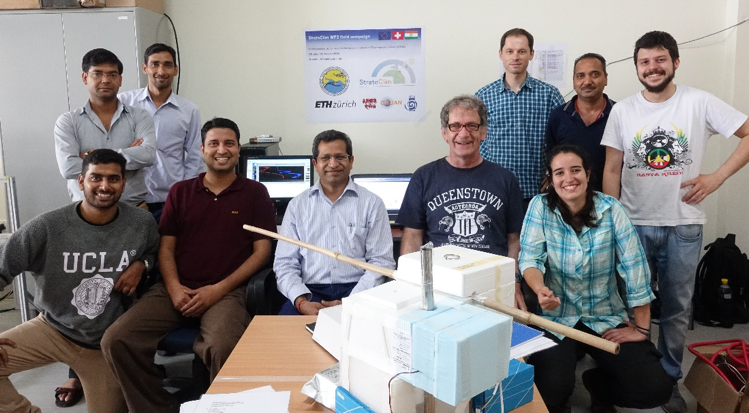
The group of Atmospheric Chemistry at IAC-ETH Zürich contributed to StratoClim’s Working Package 2 (WP2) by conducting state-of-the-art balloon-borne measurements of temperature, water vapor, ozone and aerosol backscatter in ASMA. For this aim, three intensive balloon campaigns were organized by our group and conducted during the years 2016-2017 from the stations of Nainital (India) and Dhulikhel (Nepal). Both stations are located at the southern slopes of the Himalayas, a region of deep convection during the monsoon season, and therefore a hot-spot for the transport of water vapor and pollutants to ASMA [e.g. external pageFu et al., 2006; external pagePan et al., 2016]. In addition to the balloon campaigns, an airborne campaign using the high-altitude Geophysica-M55 aircraft was also conducted within StratoClim, with base in Kathmandu airport (Nepal), and simultaneous with the balloon campaign 2017 in Dhulikhel (Nepal).
Balloon campaign 2016 in Nainital (India)
The balloon campaign 2016 in Nainital, India (29.35°N, 79.46°E) was organized by our group in collaboration with the Indian Institute of Tropical Meteorology (IITM, Pune, India) and the German Weather Service (DWD)-GRUAN lead centre (Lindenberg, Germany), and held at the Aryabhatta Institute of Observational Sciences (ARIES). The main monsoon-season campaign was performed between 2-31 August 2016 (NT16AUG), consisting of 30 balloon soundings in total (see Table 1). Most of the soundings were successful, and the NT16AUG campaign provided an unprecedented and comprehensive dataset of the UTLS structure and composition of ASMA above the southern slopes of the Himalayas. During the NT16AUG campaign, local scientists and students from IITM and ARIES were trained to the deployment of the balloon-borne payloads, who later performed 5 extra balloon soundings in November 2016 (NT16NOV).
All soundings employed the RS41-SGP meteorological radiosonde (Vaisala, Finland) for temperature measurements and to host additional instruments through its XDATA interface. Additional instruments employed were: Electrochemical Concentration Cell (ECC, manufacturer: En-Sci, USA) for ozone (O3) mixing ratio, Cryogenic Frost-point Hygrometer (CFH, En-Sci, USA) for water vapor (H2O) mixing ratio, and the Compact Optical Backscatter Aerosol Detector (COBALD, MyLab, Switzerland) for aerosol backscatter.
Balloon campaign 2017 in Dhulikhel (Nepal)
The balloon sounding campaign in Dhulikhel, Nepal (DK17) was organized by ETH Zürich in collaboration with DWD-GRUAN (Lindenberg, Germany), IITM (Pune, India), and ARIES (Nainital, India), and held at the Kathmandu University (KU) campus of Dhulikhel, Nepal (27.62°N, 79.46°E).
The same payload as for the Nainital 2016 campaign was employed for the Dhulikhel 2017 campaign. In total 28 balloon soundings were performed from the Dhulikhel station between 30 July – 12 August 2017 (see Table 1), which were mostly simultaneously with the Geophysica-M55 aircraft campaign (27 July – 10 August). Despite some severe logistic limitations restricted the number of COBALD sondes deployed during this campaign (see Table 1), a comprehensive dataset of temperature, water vapor and ozone, as well as interesting cirrus cloud observations, have been produced during DK17, allowing to characterize the composition of ASMA in 2017 and interannual variability at the southern slopes of the Himalayas.
Table 1. Number of balloon soundings performed for each instrument and campaign period. In parentheses: number of soundings with instrumental malfunctionings (CFH: number of failures and contamination events, respectively). Early burst is defined as burst altitude < 25 km. (*) Note that iMet radiosondes were used for the first two soundings in NT16AUG, instead of RS41.
Summary of key results
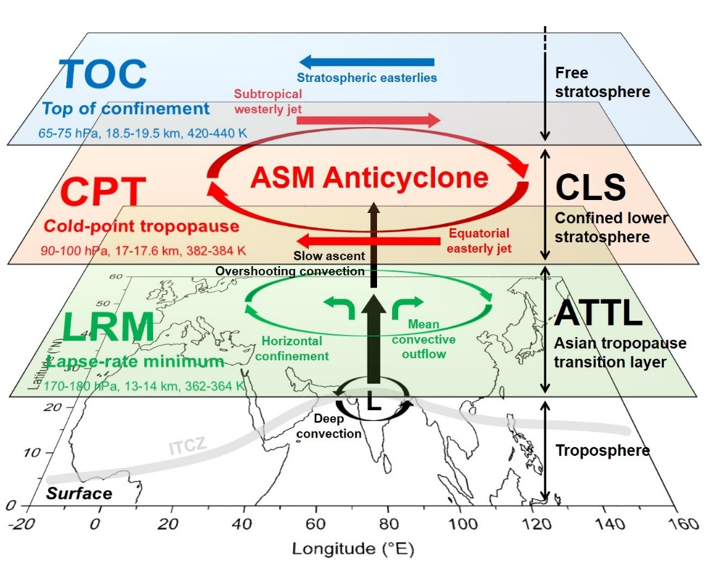
The main results obtained from the analysis of this data are discussed in the campaign overview paper, external pageBrunamonti et al. [2018]. In this work, we focus on analyzing the vertical structure of the ASM anticyclone in terms of significant levels and layers, identified from the temperature and potential temperature lapse rates and Lagrangian backward trajectories, in order to provide a framework for relating the measurements to local thermodynamic properties and the large-scale anticyclonic flow. In particular, we define the region of altitudes between the lapse rate minimum (LRM) and the cold-point tropopause (CPT) as the Asian Tropopause Transition Layer (ATTL). Further, based on air mass trajectories, we define the Top of Confinement (TOC) level of ASMA, which separates altitudes which are affected by horizontal confinement in ASMA (below TOC), from the confinement-free stratosphere above the ASMA (above TOC). Following from the definition of TOC, we define the confined lower stratosphere (CLS) as the region of altitudes above the CPT and below the TOC, i.e. the layer of lower stratosphere which is subject to confinement in ASMA, in contrast to the free stratosphere above the anticyclonic vortex (i.e. above TOC).
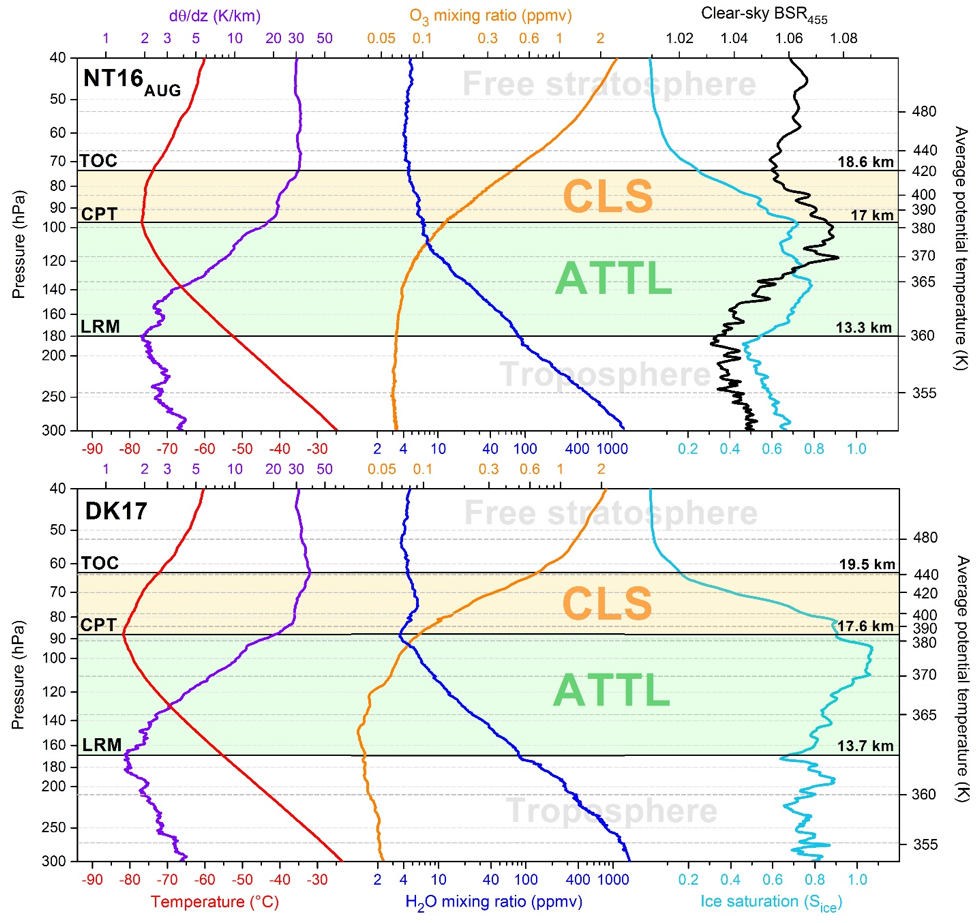
Figure 2 illustrates the vertical structure of the UTLS above the southern slopes of the Himalayas during the Asian summer monsoon season, according to the definitions of ATTL and CLS just introduced. Figure 3 summarizes mean profiles of temperature, potential temperature lapse rate (dθ/dz), H2O mixing ratio, O3 mixing ratio, ice saturation and clear-sky (i.e. aerosol) backscatter ratio at 455 nm (BSR455) measured during NT16AUG (top panel) and DK17 (bottom panel), highlighting the relevance of the significant thermodynamic levels (LRM, CPT, TOC) and layers (ATTL, CLS) introduced above.
Both our monsoon-season campaigns (NT16AUG and DK17) show evidence of deep convection and confinement in the CLS, yielding a body of air with enhanced water vapor and aerosols (inferred by cloud-filtering the COBALD backscatter measurements) and low ozone, extending up to 1.5-2 km above the CPT. This finding is particularly interesting because of its potential implications for stratospheric moistening. Since the air masses in the CLS have already crossed the CPT, hence will be unlikely subject to further dehydration, the high H2O is prone to be lifted further and mixed into the (drier) free stratosphere, thereby moistening the global stratosphere. Our analysis also shows that convective features are more pronounced in the DK17 measurements compared to NT16AUG, and in particular an isolated H2O maximum in the CLS (~ 1 km above the CPT) was observed in DK17. This feature is most likely due to overshooting convection, injecting ice crystals directly above the CPT, which then evaporate and hence hydrate the CLS (similarly to as suggested by external pageDauhut et al. [2015]). In addition to overshooting convection and diabatic ascent, the fact that the average CPTs in our datasets (380-385 K) occur at lower potential temperatures than previously found above the Tibetan plateau (385-390 K) [external pageBian et al., 2012], suggests that isentropic transport from Tibetan plateau (below CPT) to the southern slopes of the Himalayas (above CPT) might also contribute to the high H2O observed in the CLS. One further mechanism that could explain this finding is turbulent mixing due to breaking waves near the CPT, as recently suggested by external pageGlenville and Birner [2017]. Further investigations aimed to assess the relevance of such different transport processes with respect to stratospheric moistening via the ASM anticyclone are ongoing.
References
Bian, J., Pan, L. L., Paulik, L., Vömel, H., Chen, H, and Lu, D.: In situ water vapor measurements in Lhasa and Kunming during the Asian summer monsoon, Geophys. Res. Lett., 39, L19808, doi:10.1029/2012GL052996, 2012
Brunamonti, S., Jorge, T., Oelsner, P., Hanumanthu, S., Singh, B. B., Kumar, K. R., Sonbawne, S., Meier, S., Singh, D., Wienhold, F. G., Luo, B. P., Böttcher, M., Poltera, Y., Jauhiainen, H., Kayastha, R., Karmacharya, J., Dirksen, R., Naja, M., Rex, M., Fadnavis, S., and Peter, T.: Balloon-borne measurements of temperature, water vapor, ozone and aerosol backscatter at the southern slopes of the Himalayas during StratoClim 2016-2017, Atmos. Chem. Phys., 18, 15937-15957, https://doi.org/10.5194/acp-18-15937-2018, 2018 (https://www.atmos-chem-phys.net/18/15937/2018/)
Dauhut, T., Chaboureau, J.-P., Escobar, J., and Mascart, P.: Large-eddy simulations of Hector the convector making the stratosphere wetter, Atmos. Sci. Lett., 16, 135-140, DOI:10.1002/asl2.534, 2015
Gettelman, A. and de F. Forster, P. M.: A climatology of the Tropical Tropopause Layer, J. Meteorol. Soc. Japan, 80, 911-924, 2002
Pan, L. L., Honomichl, S. B., Kinnison, D. E., Abalos, M., Randel, W. J., Bergman, J. W., and Bian, J.: Transport of chemical tracers from the boundary layer to stratosphere associated with the dynamics of the Asian summer monsoon, J. Geophys. Res. Atmos., 121, 14159-14174, doi:10.1002/2016JD025616, 2016
Ploeger, F., Konopka, P., Walker, K., and Riese, M.: Quantifying pollution transport from the Asian monsoon anticyclone into the lower stratosphere, Atmos. Chem. Phys., 17, 7055-7066, https://doi.org/10.5194/acp-17-7055-2017, 2017
Vernier, J.-P., Fairlie, T. D., Natarajan, M., Wienhold, F. G., Bian, J., Martinsson, B. G., Crumeyrolle, S., Thomason, L. W., and Bedka, K. M.: Increase in upper tropospheric and lower stratospheric aerosol levels and its potential connection with Asian pollution, J. Geophys. Res. Atmos., 120, 1608-1619, doi:10.1002/2014JD022372, 2015