Atmospheric Methane
Involved group members: Aryeh Feinberg, Thomas Peter, Andrea Stenke
Methane (CH4) is the second most important greenhouse gas after CO2 in terms of radiative forcing (external pageIPCC, 2013). Methane has many man-made and natural sources. Anthropogenic sources include rice cultivation, ruminants, landfills, waste management, biomass burning, and extraction, distribution and combustion of fossil fuels. Natural sources include wetlands, lakes, geologic seeps, termites, wildfires and ocean emissions, with natural wetlands being the single largest methane source (25%-40% of total emissions).
Since pre-industrial times, atmospheric CH4 concentrations have more than doubled. Although global CH4 emissions continue to rise, the rate of accumulation in the atmosphere, or growth rate, has significantly decreased since the 1980s from ~130 ppbv/decade to almost zero during the period 1999-2007. Since 2007, the CH4 growth rate has again been on the rise (~60 ppbv/decade). The mechanisms responsible for this strange behavior continue to be debated.
Global chemistry-climate models like SOCOLv3 usually prescribe globally or hemispherically averaged CH4 mixing ratios as lower boundary conditions. This is related to the strong sensitivity of atmospheric CH4 burdens to the presence of the hydroxyl radical (OH). OH levels, in turn, are determined by photochemical interactions between nitrogen oxides (NOx), volatile organic compounds (VOCs), but also CH4 itself. The exact processes and reactions behind OH are not yet understood, and therefore difficult to represent in global models.
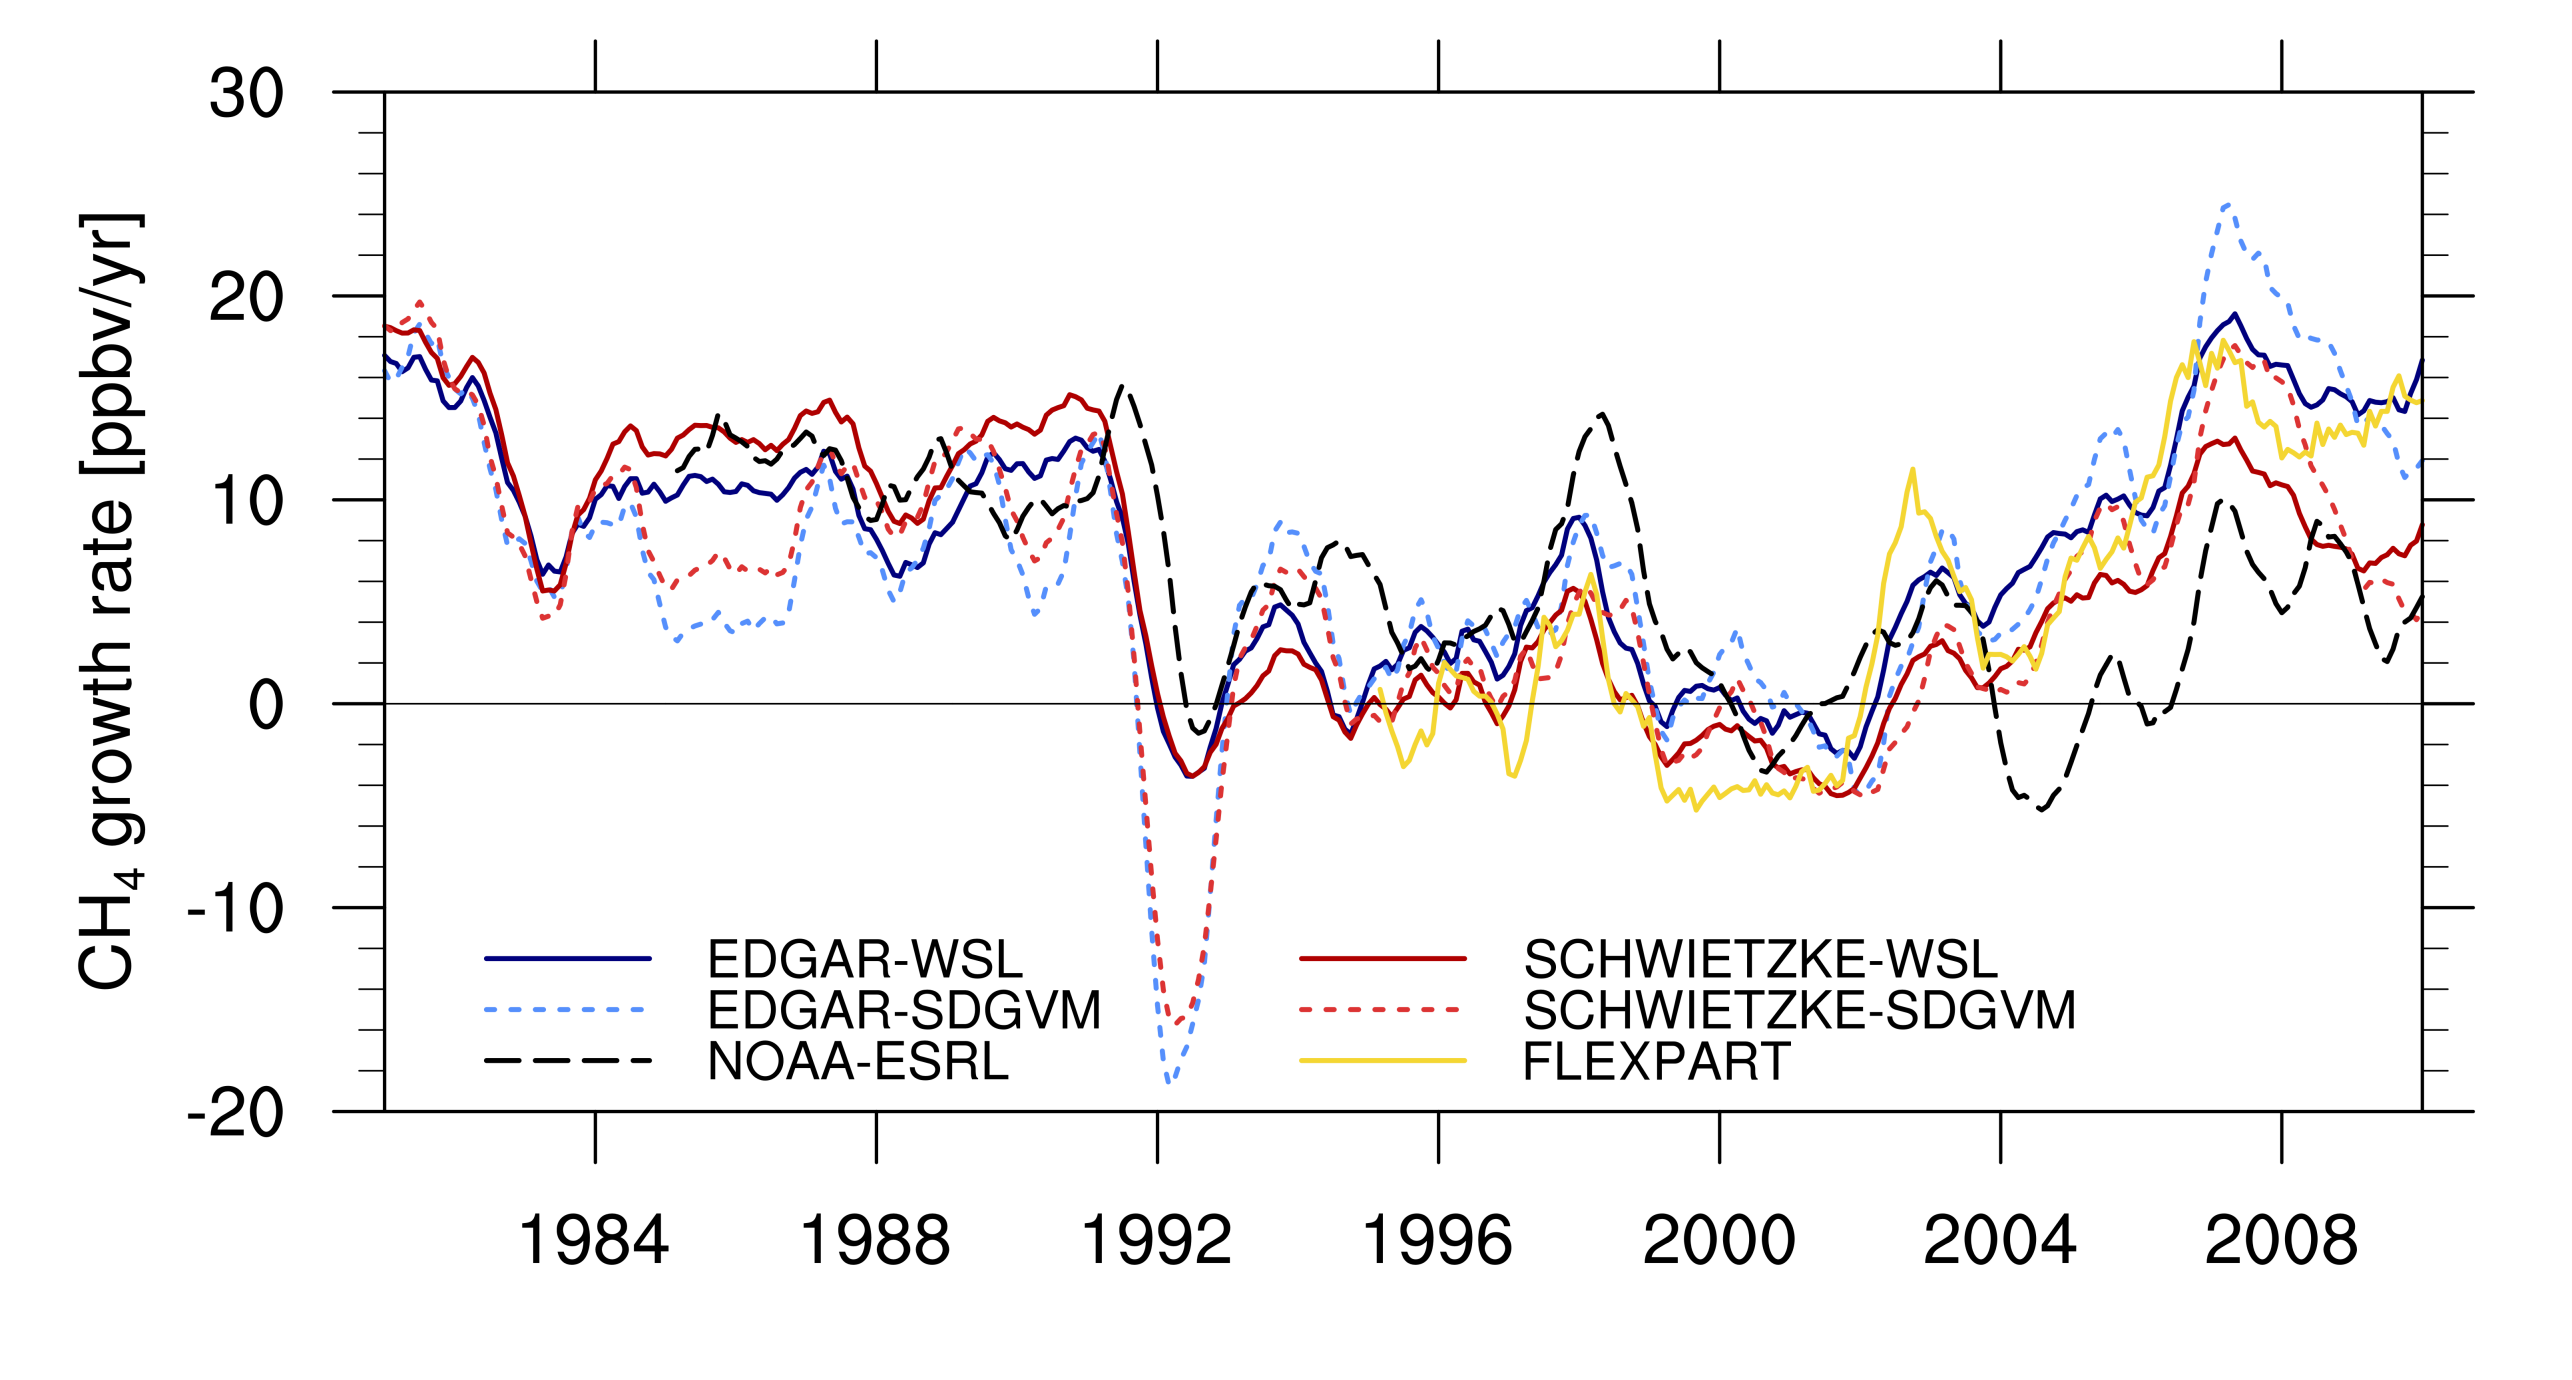
Here we applied SOCOLv3 with a CH4 flux boundary condition and with an additional tracer diagnostic, which allow to track CH4 emitted from various source categories and emission regions. Uncertainties in existing emission flux estimates were addressed by combining two data sets for wetland emissions based on process-based models (LPJ-WSL and SDGVM) with two anthropogenic emission inventories (EDGAR4.2 and SCHWIETZKE). The model is capable of reproducing several features of the observed growth rate time series, although the SDGVM-based simulations overestimate the drop after the Mt. Pinatubo eruption in 1991 or underestimate the peak linked to the 1997/98 El Niño event. The reinforced CH4 increase after 2004 is overestimated in all model scenarios, by 230% to 380%, because both anthropogenic inventories exaggerate Chinese emissions. The comparison with results from the Lagrangian chemistry-transport model FLEXPART (orange line), which assumes a constant, prescribed OH distribution, shows that the main features of the global average CH4 growth rate are determined by the emission inventories and not by changes in the chemical CH4 loss.
Methane isotopes
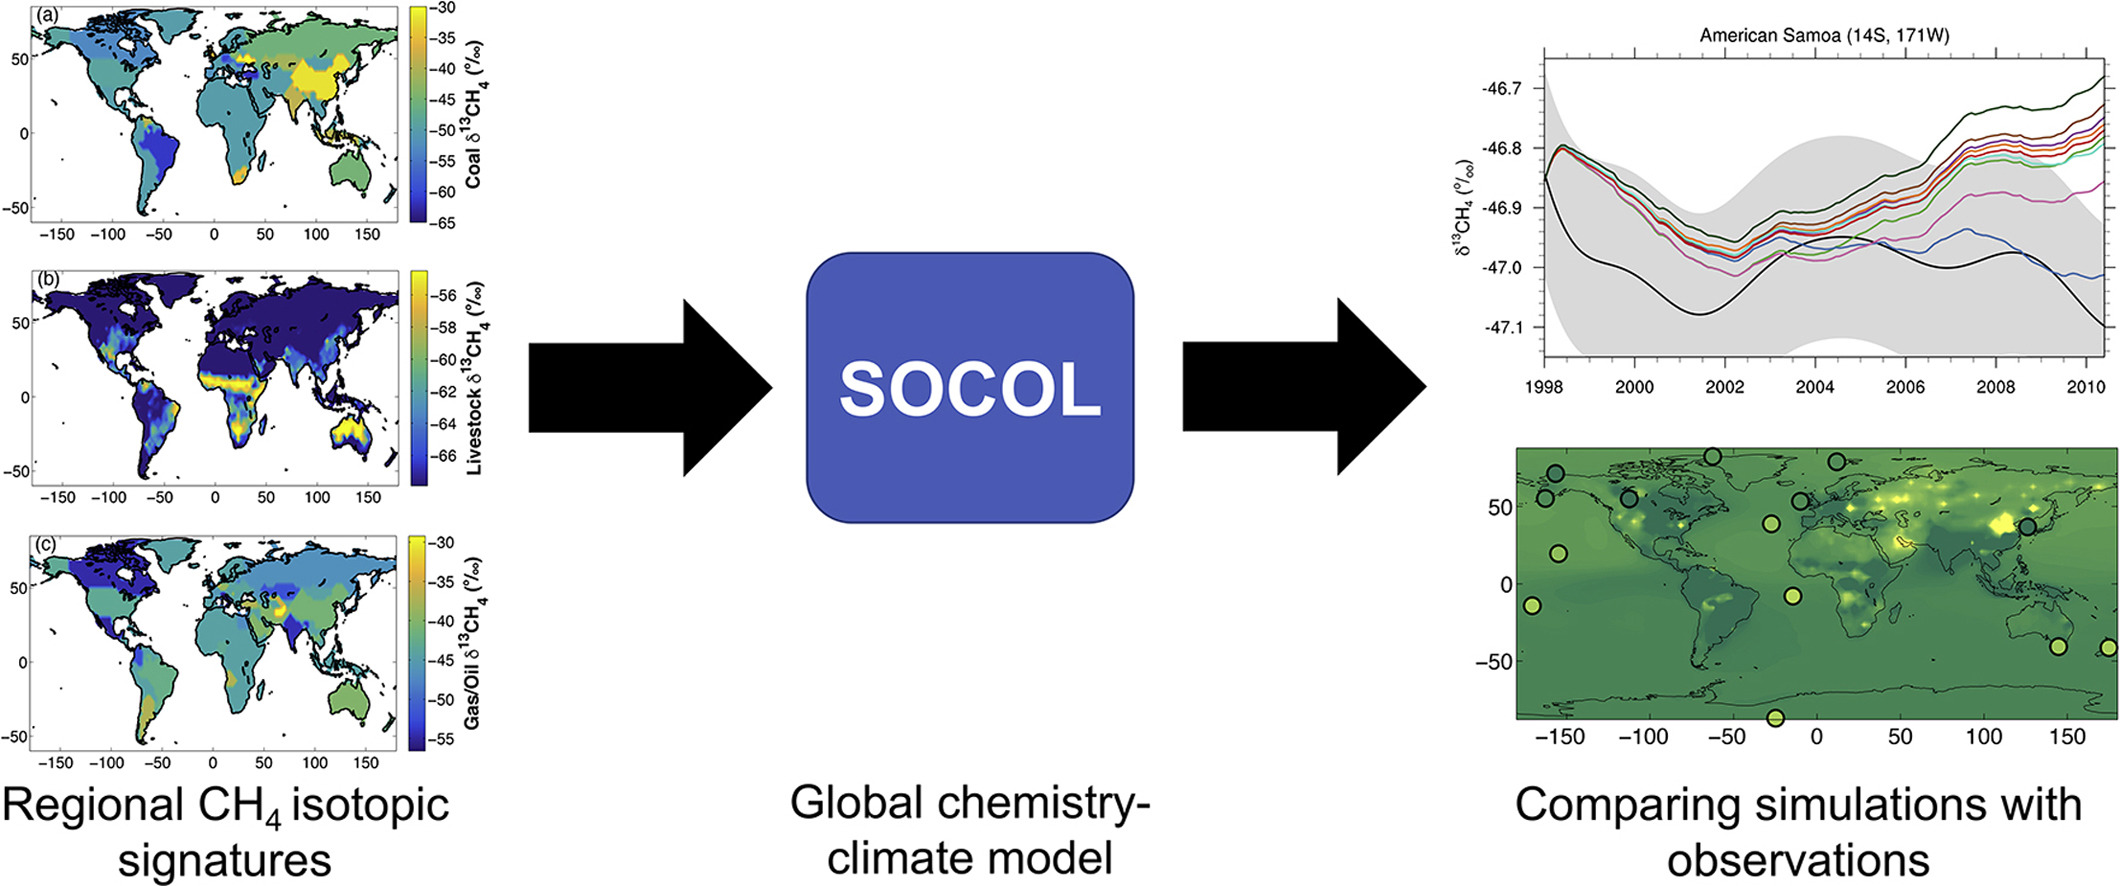
The isotopic ratio of the stable carbon isotopes 13CH4 and 12CH4 has been used in many studies to constrain the causes of the observed inter-annual variability in atmospheric CH4 growth rates. The emitted isotopic ratio depends on three factors: the isotopic ratio of the initial source material, fractionation during the CH4 production process, and whether/how much oxidation occurs before the CH4 is emitted to the atmosphere. Chemical sinks also alter the atmospheric isotope ratio due to distinct isotopologue reactivities. Therefore, measurements of the isotopic ratio can provide insights into changes in the sources and sinks. However, published isotopic source signatures are based on limited data and may not be accurate. Furthermore, past modelling studies have mostly used global mean isotopic signatures, with little consideration of regional variability in the signatures.
external pageFeinberg et al. (2017) investigated the impact of regionally varying isotopic source signatures on the simulated 𝛿13CH4 trends and spatial distribution. Instead of applying a global mean isotopic signature for individual source categories like biomass burning, we created maps with regional isotopic signatures, applied them in our chemistry-climate model SOCOLv3 and investigated the impact on simulated trends and spatial distributions of the isotopic ratio. Based on recently published source signature datasets, our calculated global mean isotopic signatures are in general lighter than the commonly used values. Trends in several isotopic signatures were also apparent during the period 1990–2010. The agreement between the modelled and observed 𝛿13CH4 interhemispheric differences improves when regional source signatures are used. Even though the simulated results are highly dependent on the choice of methane emission inventories, they emphasize that the commonly used global mean signatures are inadequate. Regional isotopic signatures should be employed in modelling studies that try to constrain methane emission inventories.