Tropospheric Ozone
Involved group members: Thomas Peter, Andrea Stenke, Franziska Zilker
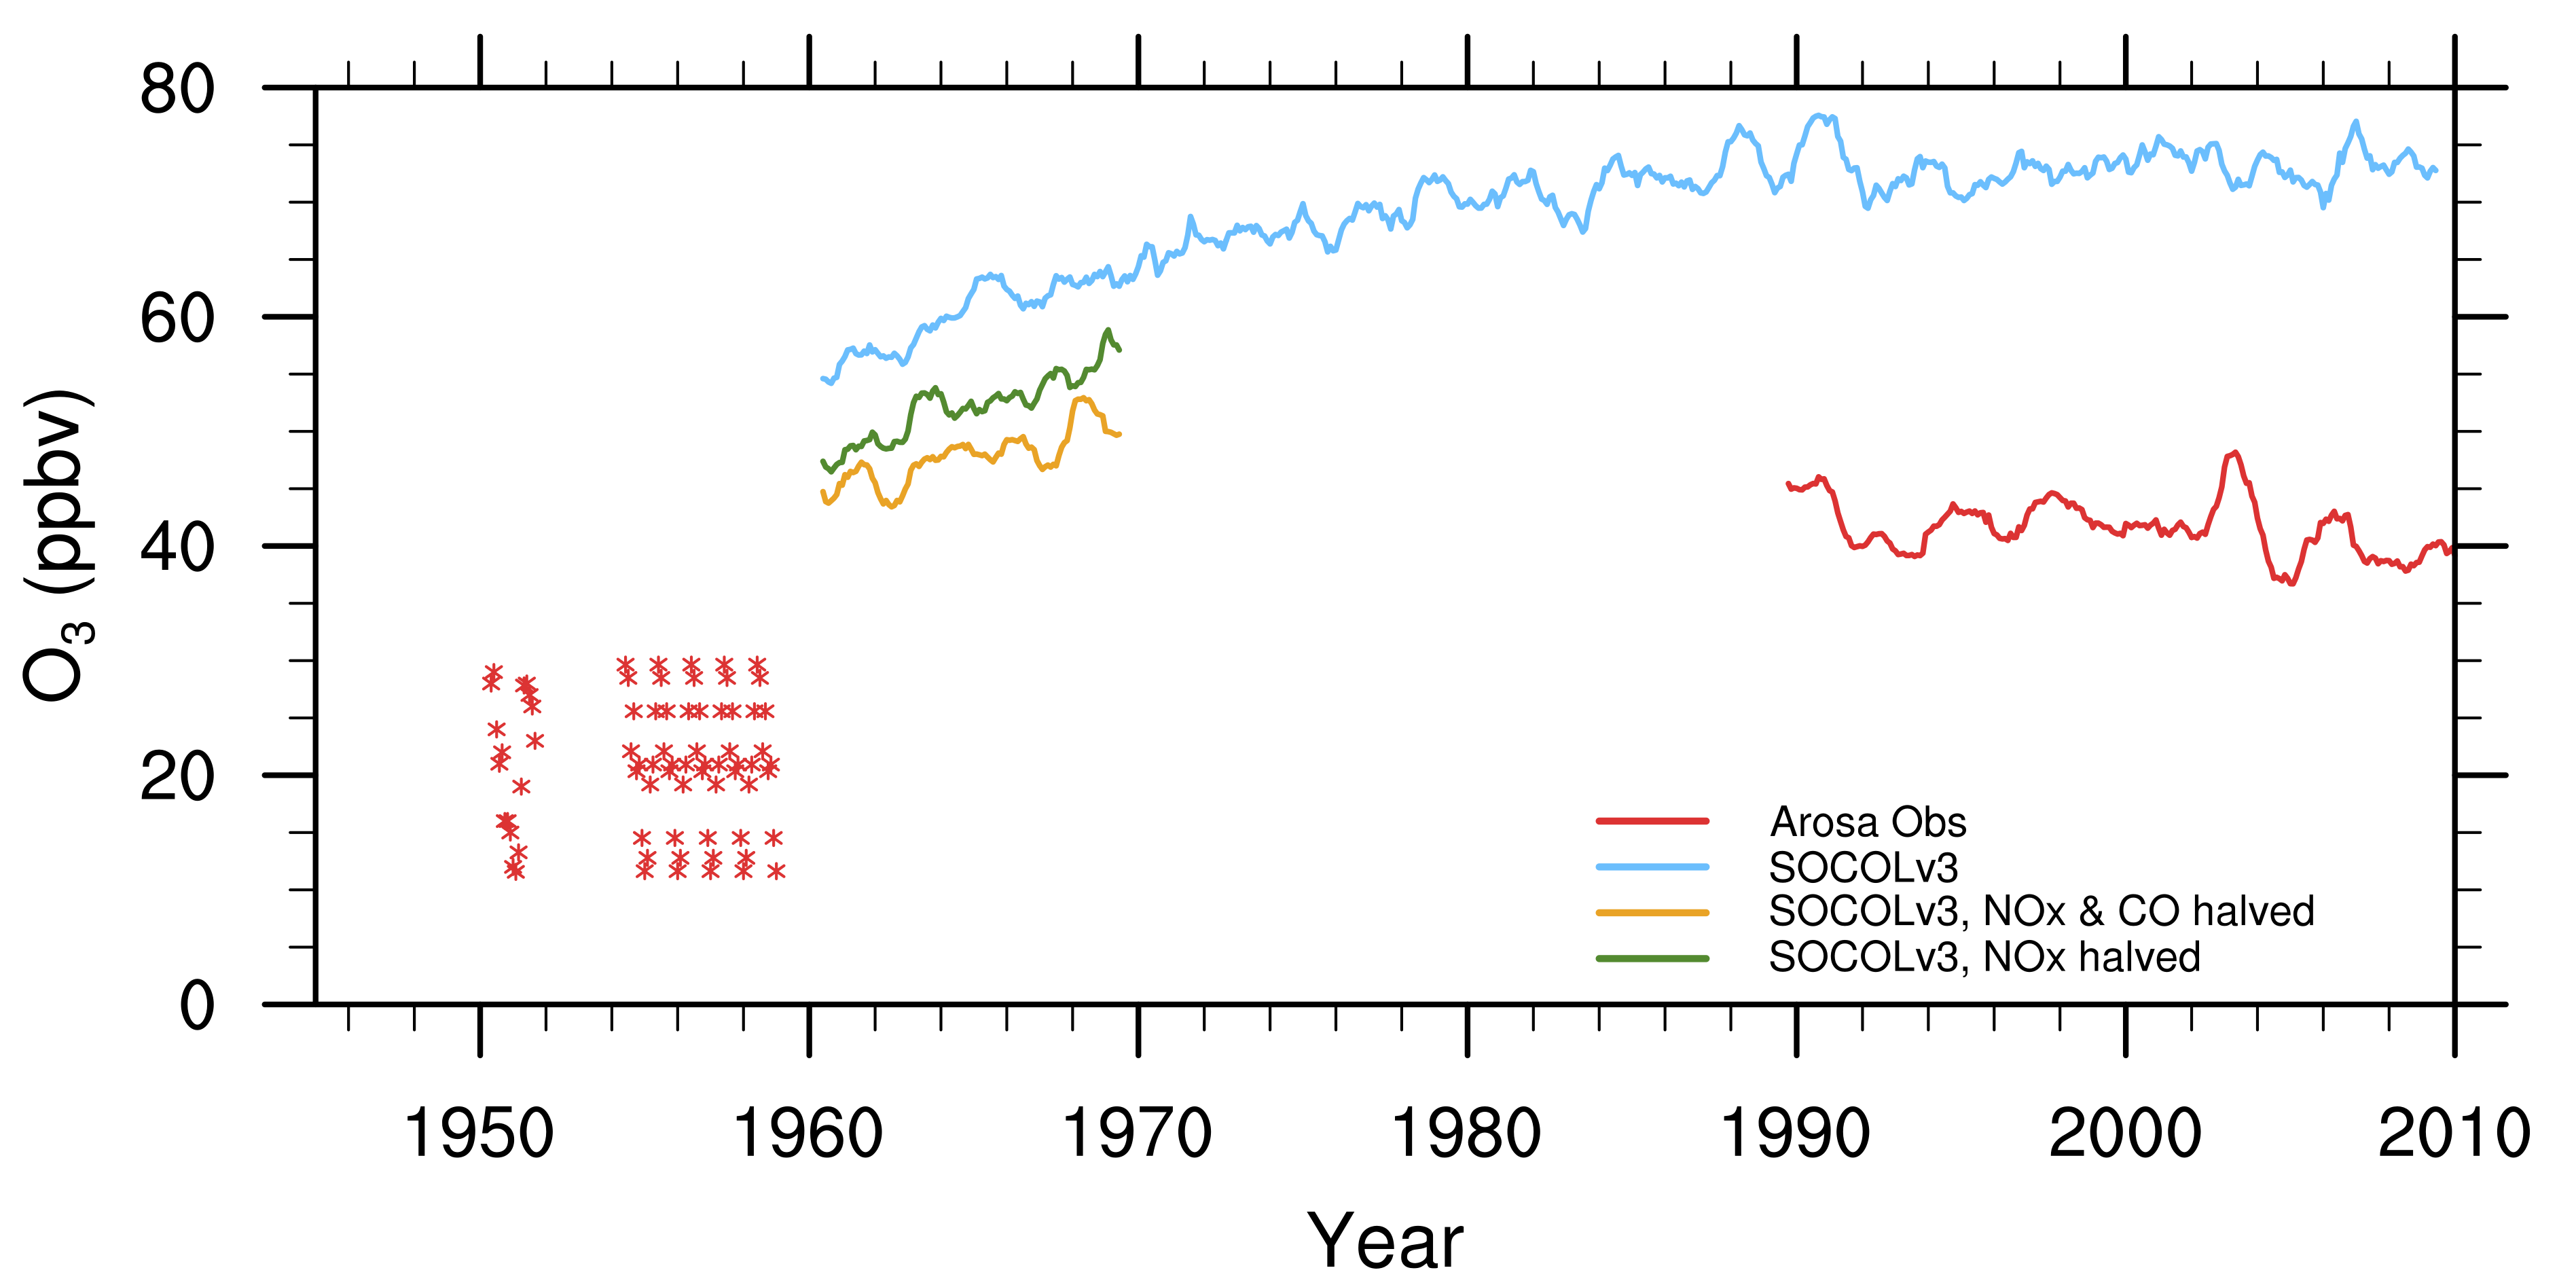
Tropospheric ozone is a powerful greenhouse gas and harmful air pollutant. Ozone is not directly emitted. The majority, about 90%, of ozone in the troposphere is photochemically produced through the oxidation of carbon monoxide (CO), CH4, and non-methane hydrocarbons (NMHCs) in the presence of nitrogen oxides (NOx = NO + NO2). Influx of ozone from the stratosphere accounts for the remaining ~10%. By comparison with measurements chemistry-climate models like SOCOL have been found to overestimate tropospheric ozone in northern mid-latitudes by up to ~30% external page(Revell et al., 2015), and at the same time underestimate the ozone change observed over the past 50 to 60 years by ~50% (external pageStaehelin et al., 2017). The reasons for these deficiencies, which are likely model dependent, are presently unclear, though uncertainties in ozone precursor emissions are seen as a suspect.
STOMA-CAP (Franziska Zilker)
The Stratospheric-Tropospheric Ozone Modelling for Analysis of Climate Change and Air Pollution (STOMA-CAP) project aims to identify the reasons for these tropospheric ozone biases found in current chemistry climate models and to understand the drivers of regional changes observed in tropospheric ozone. These goals are essential for reliable projection of future tropospheric ozone, its radiative forcing and air quality, and based on that, policy decisions on appropriate mitigation measures. Using our chemistry-climate model, SOCOLv3, we will specifically address the following research questions:
- Why do CCMs typically overestimate tropospheric ozone concentrations in northern mid-latitudes for present-day conditions?
- Why do models capture only ~50% of the tropospheric ozone changes observed in the past?
- Why has free tropospheric ozone over Europe not decreased, despite regulations on ozone precursor emissions since the late 1980s?
- What are the relative impacts of changing emissions, long-range transport of ozone and precursors, and stratosphere-to-troposphere transport, on tropospheric ozone, and therefore on the terrestrial radiation budget and air quality?
To answer the above mentioned questions, we will extend our CCM SOCOLv3 by an improved photolysis scheme. With the updated model version we will run a set of model simulations, which can be subdivided into two time periods:
- Model simulations with dynamical and chemical nudging from 1985 to present day.
- Updated ozone projections for the 21st century under RCP6.0.
The simulation of the past will help us to identify research gaps and shape further development of CCM. The projection simulations will re-investigate the study by external pageRevell et al. (2015) to provide updated projections of tropospheric ozone for the 21st century and to re-investigate the role of precursor emissions.
Understanding tropospheric ozone changes in the 21st century
external pageRevell et al. (2015) used the SOCOL global chemistry-climate model to investigate the changes in tropospheric ozone over the 21st century under a relatively strong climate change scenarios (Representative Concentration Pathway (RCP) 6.0). Several chemical and transport tracers were integrated into the model to better understand particular sources and sinks of ozone. The influence of several factors was explored: changes in ozone precursor emissions, climate change (including methane effects) and stratospheric ozone recovery. Changes in ozone precursor emissions were found to have the largest impact on tropospheric ozone, resulting in a global mean increase of up to 23% compared to 1960 levels that sees a peak in the early 21st century (see Figure). The increase is most evident in the northern mid-latitudes, where increasing emissions from the Asian sector strongly affect zonal tropospheric ozone concentrations.
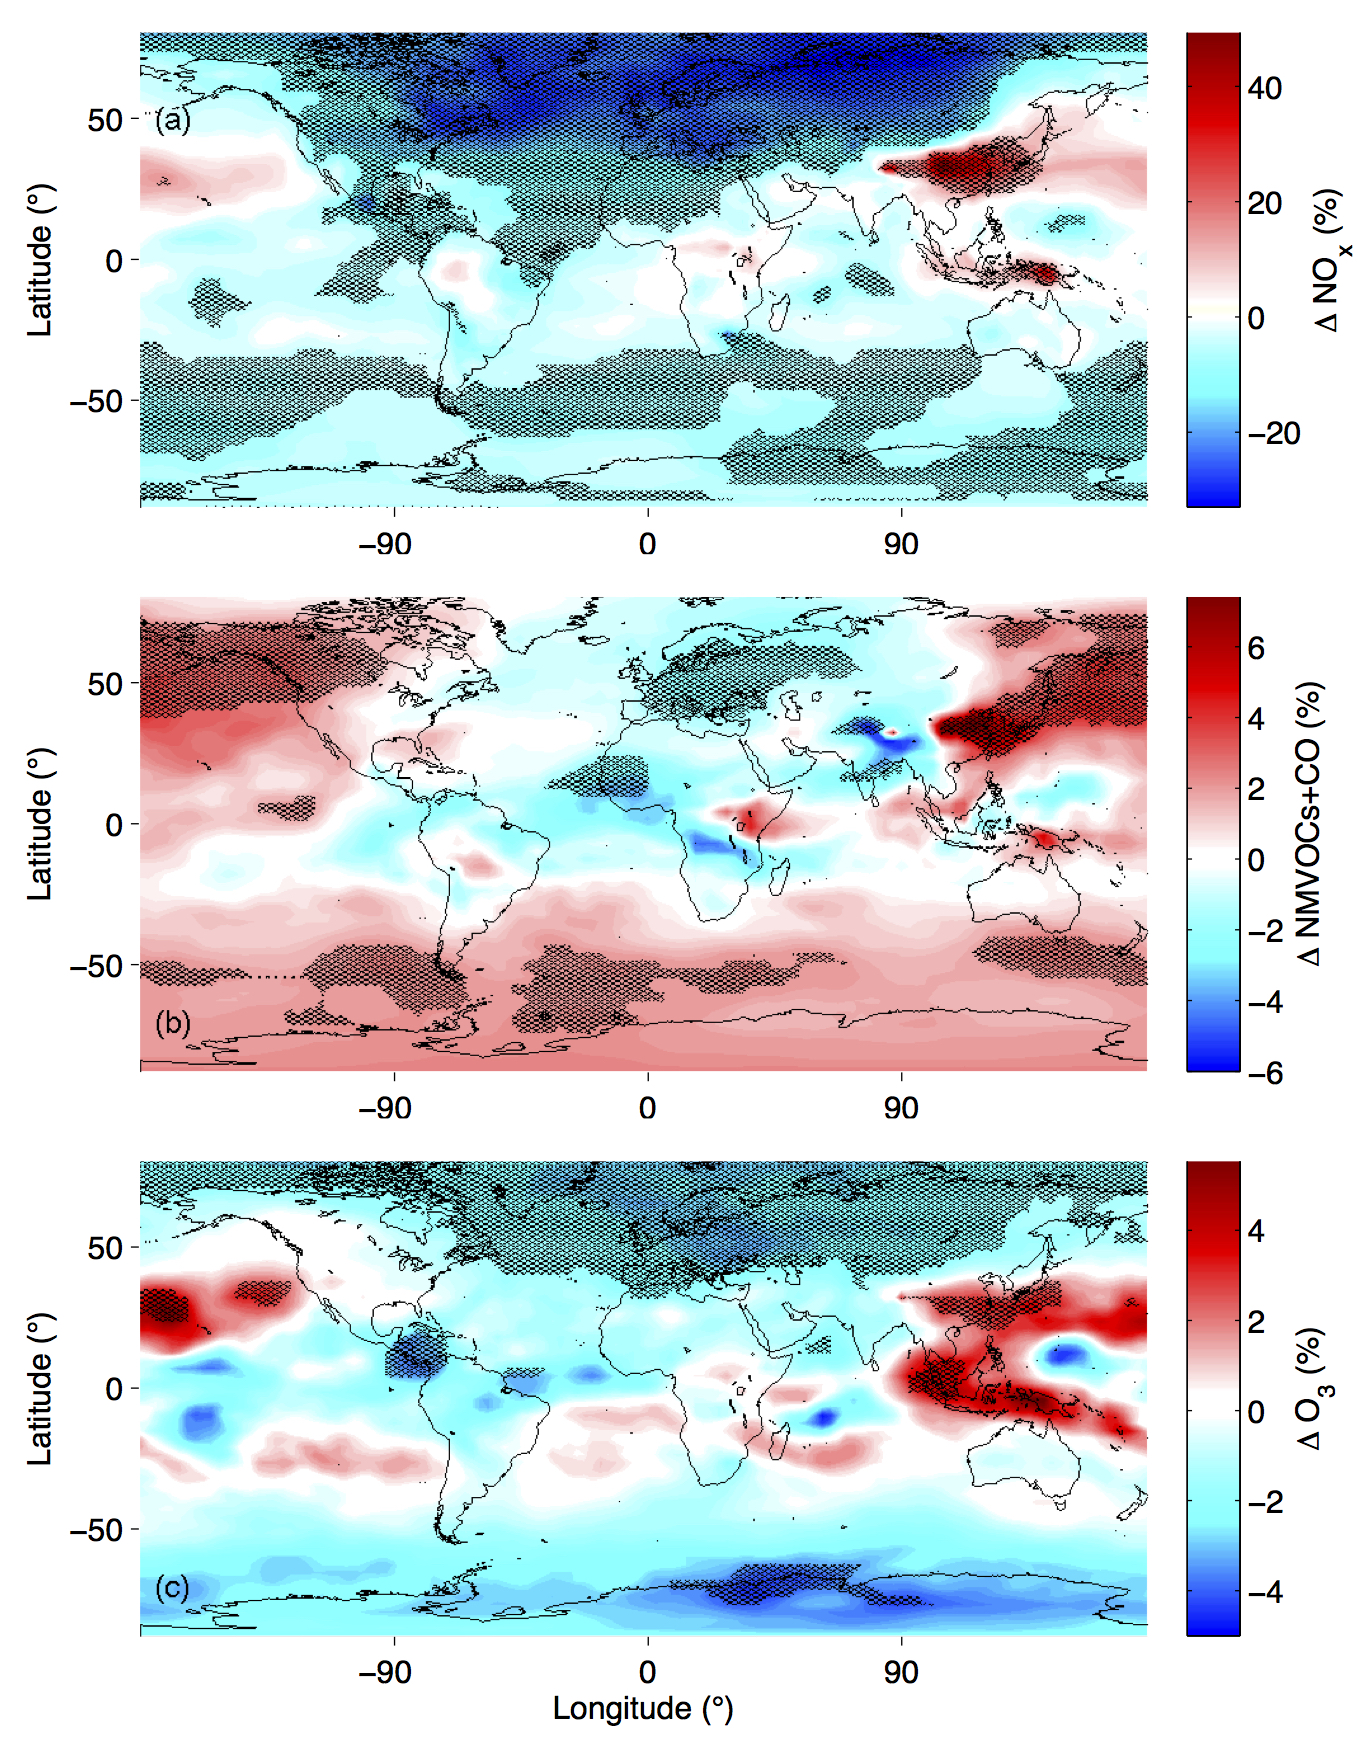
A sensitivity simulation with ozone precursor emissions fixed at 1960 levels showed only 6% increase in global mean tropospheric ozone by the end of the 21st century, which results largely from increases in methane emissions (not held constant in the simulation). Increases in transport of ozone from the stratosphere to the troposphere as well as climate change-induced increases in lightning NOx emissions also increase tropospheric ozone levels, but their impacts remain small. Therefore, global emission policies for ozone precursor emissions have a critical role to play in determining tropospheric ozone levels over the 21st century.