Vertical Changes in Stratospheric Ozone
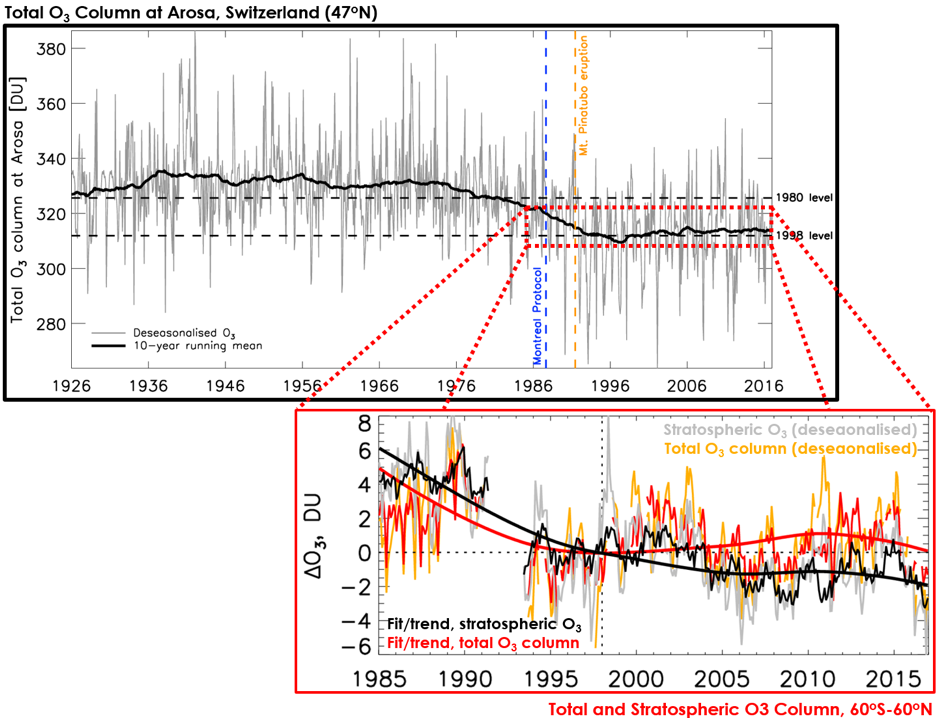
Stratospheric ozone protects life on Earth by absorbing harmful solar UV (ultraviolet) radiation. The emission of anthropogenic Ozone Depleting Substances (ODSs) since the 1970s led to stratospheric ozone losses (Fig 1, upper panel). Since the 1987 Montreal Protocol and its subsequent amendments were adopted, rapid ozone depletion has ceased. While long-term ground-observations have been maintained at single locations for nearly a century (Fig 1), satellite systems are essential to monitor the progress of recovery in global ozone. However, no single long-term satellite instrument record exists, so they need to be merged. However, this prohibits robust confirmation of a recovery since data-merging approaches can introduce artefacts that bias estimates. Additionally, and climate change affects both chemistry and transport of stratospheric ozone and therefore it is difficult to separate and quantify the effect of reducing ODSs from that of climate change.
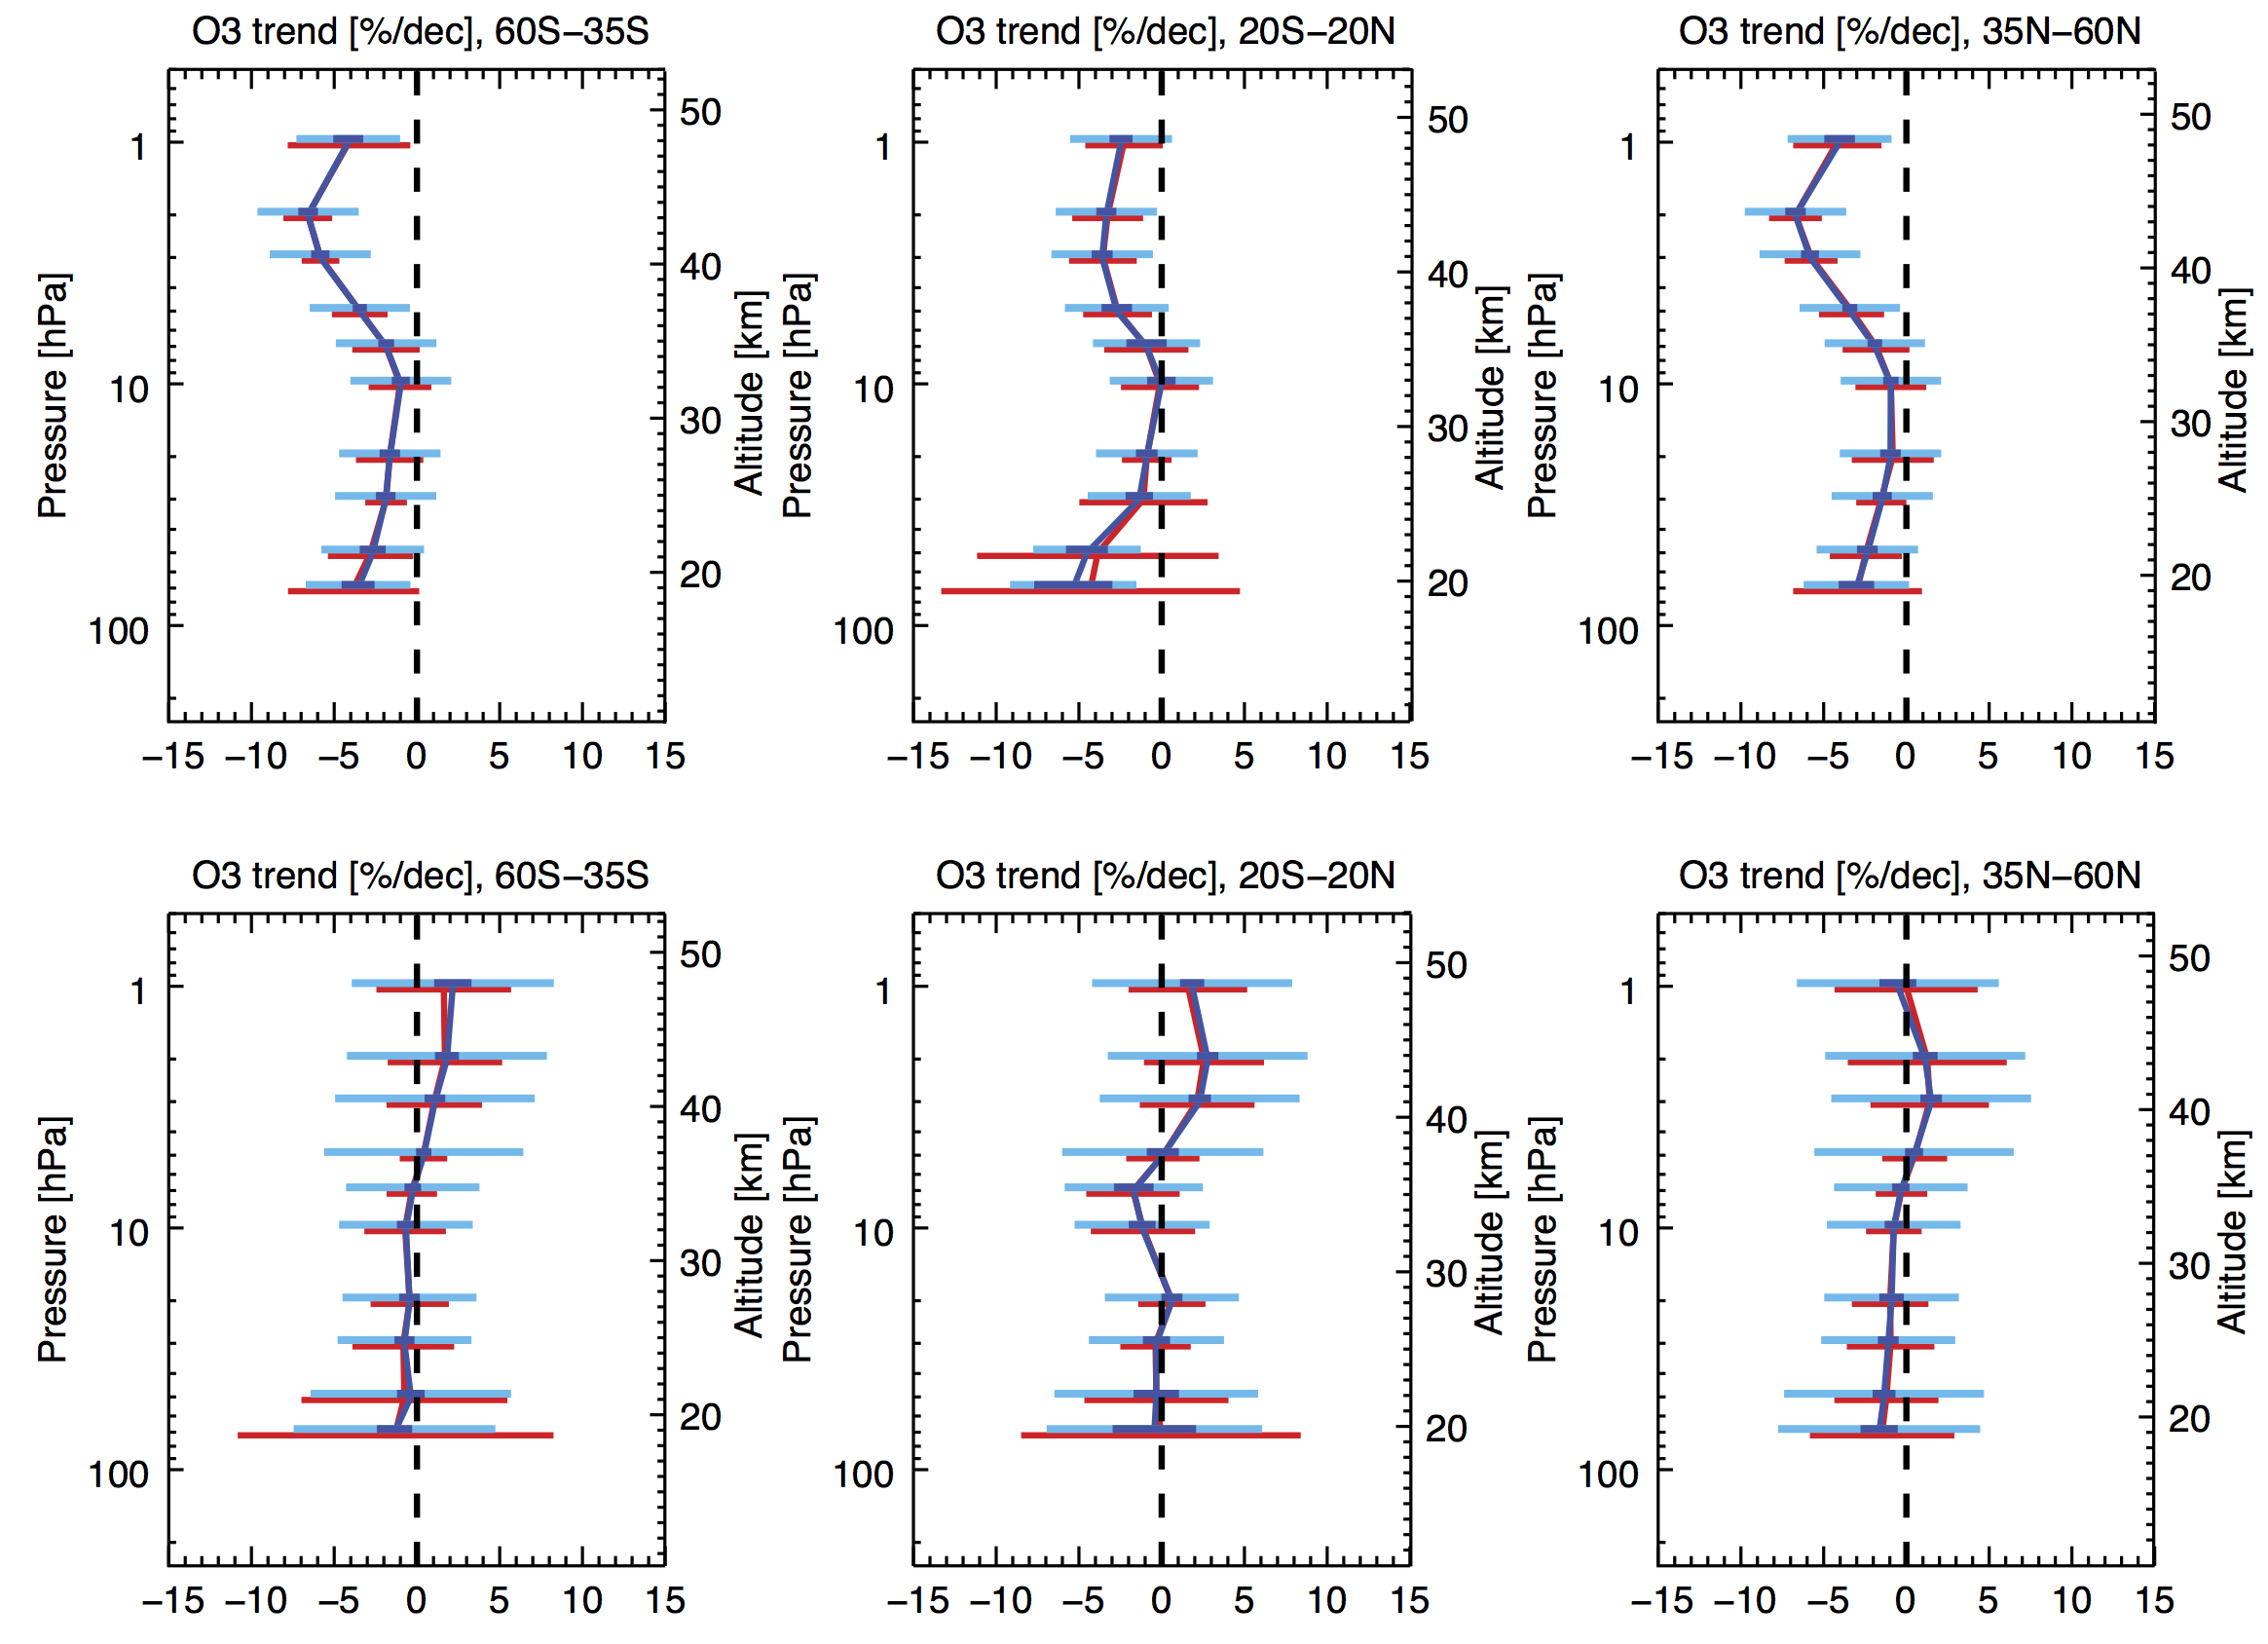
Researchers from the group have participated in the SPARC (Stratosphere-troposphere Processes And their Role in Climate) activities on trends in satellite ozone profiles (called ‘Si2N’ and ‘LOTUS’, see www.sparc-climate.org). Together with a large group of international researchers, we re-examined trends in long-term stratospheric ozone records since 1985 (external pageTummon et al., 2015; Harris et al., 2015). Trends were separated into two distinct periods: prior to 1998, when ODS emissions increased, and after 1998 when ODS emissions began decreasing. Until 1998, upper stratospheric trends were negative, ranging from -5 to -10%/decade; the quality of data in the lower stratosphere precluded making firm statements about ozone trends. Post-1998, most stratospheric ozone had small, positive trends of 2 to 3%/decade, though their significance critically depended on assumptions made about the independence the datasets. This change between periods demonstrates the beneficial effect of the Montreal Protocol on the ozone layer.
Group researchers then led major steps to develop and apply new statistical algorithms to resolve data independence and merging problems (external pageBall et al., 2017). This effort led to the discovery that lower stratospheric ozone was significantly lower in 2016 than in 1998 (see figure below), and that this change had offset the upper stratospheric recovery (external pageBall et al., 2018). However, as of today, the cause remains undiagnosed, but dynamical rather than chemical changes are suspected. We, and the research community, are now working to understand this new development and, most importantly, to determine if this will continue as a long-term trend in the future development of the ozone layer.