Extreme Events
Climate extremes, such as heat waves and heavy precipitation events, can induce major ecological, societal and economical impact. Along with anticipated climate change there are concerns that the frequency and intensity of extreme events may increase in response to atmospheric warming.
In this motivation, a major interest of our research group is (1) the future projected occurrence of extreme events and (2) the proper representation of extreme events and associated processes in state-of-the-art climate models.
Analyses on future projections are typically based on the most recently available regional climate model ensemble datasets. The regional focus of our work is on Europe and the Alpine region in particular. The Alps in specific are highly sensitive to climate variability and extremes and prone to be a hotspot where heavy precipitation events occur more frequently than elsewhere. In the recent past, heavy precipitation events in the Alps have caused tremendous damage and impact, and affected large parts of central Europe (e.g. Aug. 2005, Aug. 2013).
Past analyses on extremes and their projected change have been based on coordinated European multi-model ensemble datasets, such as PRUDENCE (at 50km horizontal resolution) and ENSEMBLES (25km). At the moment, our group is investigating the most recent EURO-CORDEX simulations at 12km and 50km horizontal resolution.
Studies from our group were among the first to find that hot temperature extremes are projected to increase more than the mean temperature (Schär et al, 2004). In this motive, we also intensively study processes and mechanisms associated with the occurrence of heat-waves (e.g. soil-moisture anomalies; Seneviratne 2006, Fischer 2007), the increase in temperature variability (Fischer 2009, Fischer 2012, see Fig. 1) and changes in the European summer-climate in general (Kröner et al., in prep).
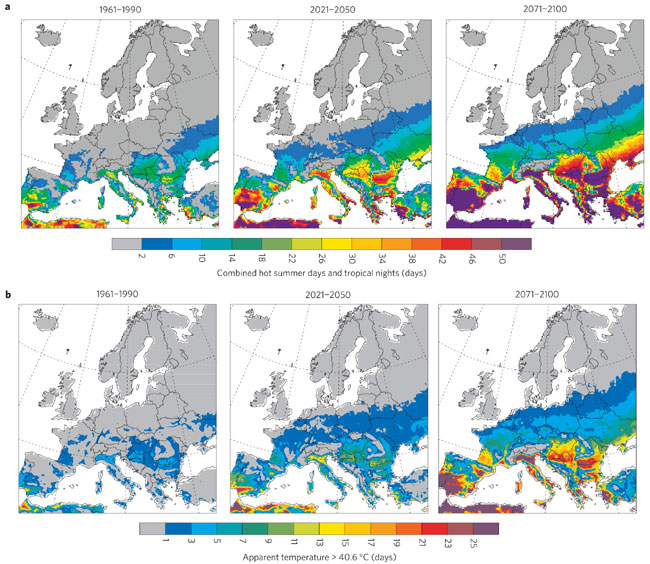
We have also found systematic and consistent patterns in the future occurrence of high-impact temperature extremes in Europe. There are indications that densely populated areas in Southern Europe are likely to suffer substantially from the consequences of climate change (Fischer 2010, see Fig. 2).
Our group has a long tradition in the analysis of precipitation extremes involving research activities on impacts and observed, simulated and projected trends and patterns from various perspectives.
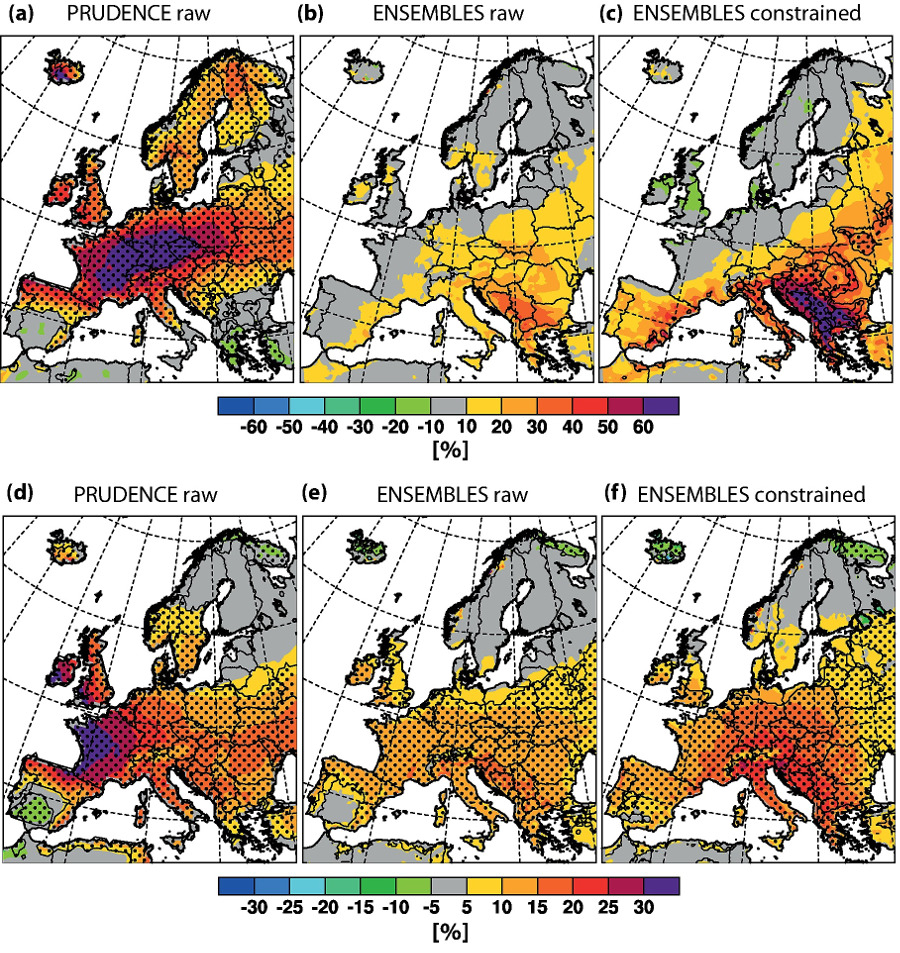
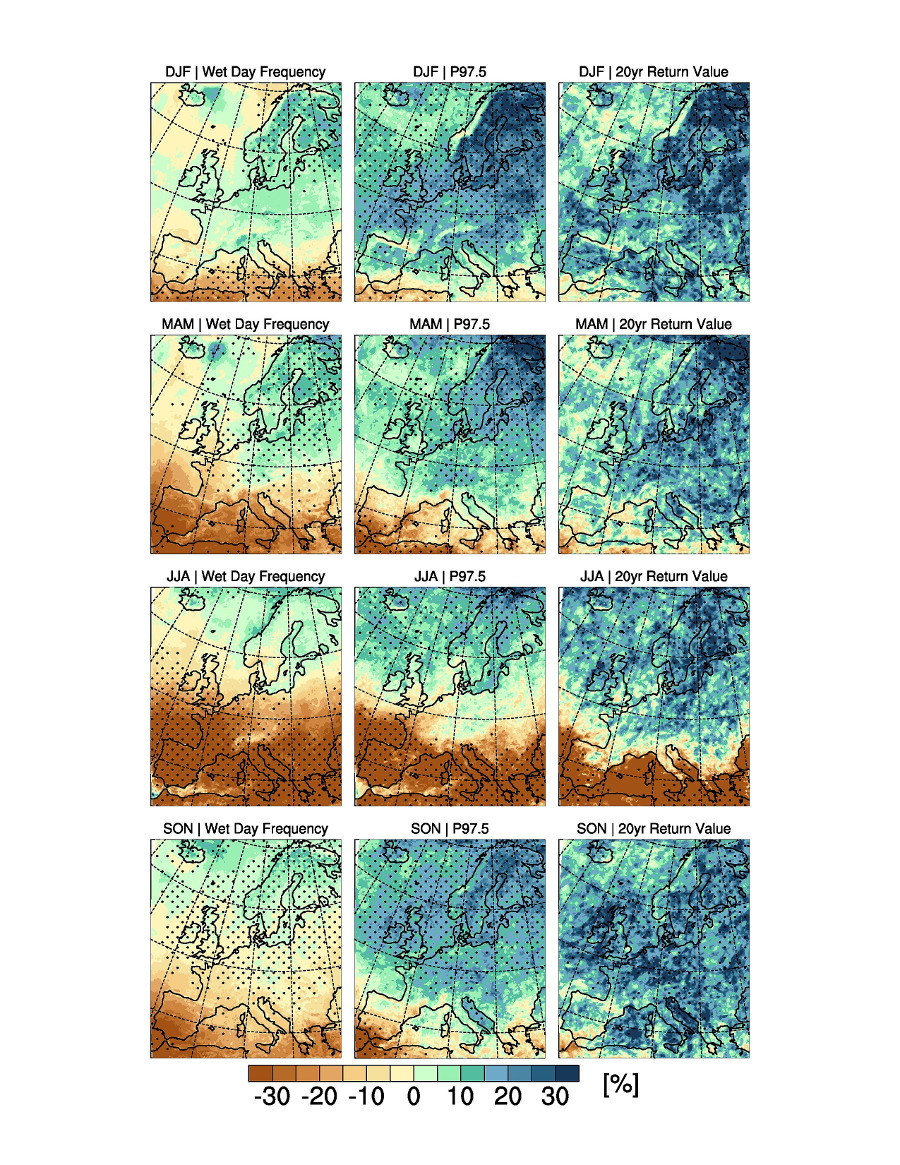
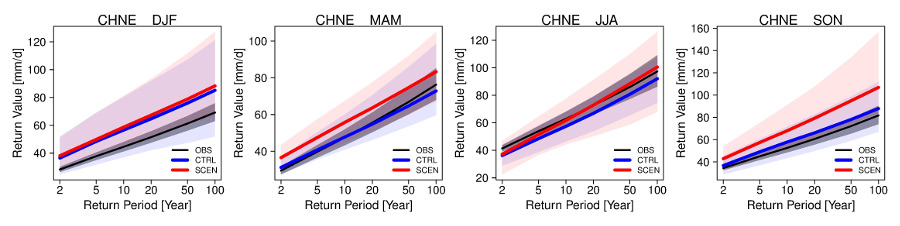
Projections have been assessed based on high-resolution regional climate model ensembles for Europe (e.g. PRUDENCE: Frei 2006, ENSEMBLES: Rajczak 2013). We find complex changes in the hydrological cycle at the end of the 21st century, with an increased risk of both drought (i.e. extended dry spells) and heavy events in many European regions (Fig. 4). A study of our group finds a prominent decrease in return periods of high-impact precipitation events (Rajczak 2013, see also Fig. 4). For instance, in the Northeastern Switzerland (i.e. region of Zurich) and in fall, a once in 50-years event under present conditions is projected to occur once every 20 years in the future. Currently we analyze the consistency of patterns found throughout previous datasets in new high-resolution climate change simulations.
Our group has also undertaken investigated methods to assess changes in heavy precipitation (Frei and Schär, Schär 2015).
Studies related to observational datasets have described spatial and temporal patterns and trends in Alpine precipitation (Frei et al., 2006). End-user oriented hydrological applications have focused on the prediction and assessment of floods. Here, a particular focus is on the river Rhine and its sub-catchments. The improvement of simulating precipitation (and its extremes) in state-of-the-art kilometer-scale convection-resolving climate simulations is an additional major research topic in our group.
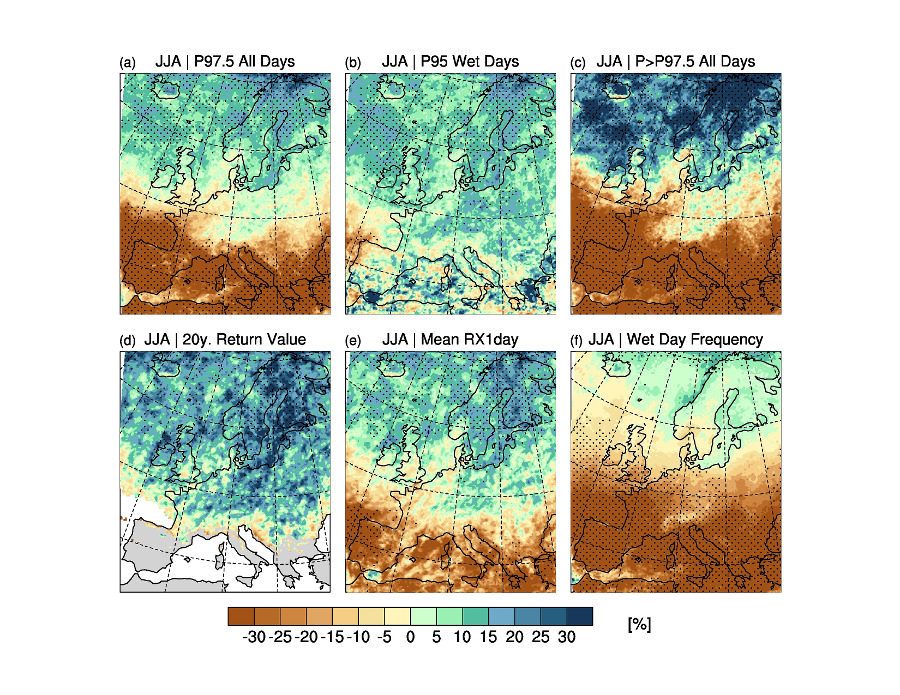
New paper: Percentile indices for assessing changes in heavy precipitation events
Trends and changes in heavy precipitation are often assessed using percentile indices. In a recent paper, we compare different approaches toward percentile calculations and highlight substantial differences between the different in the context of climate change (Schär et al., 2016). In fact, we highlight the danger of using wet-day percentiles and claim that all-day percentile should be used in climate-change studies. In the paper we elaborate a variety of percentile methods and GEV (see Fig.5) and provide a systematic overview of the different methodologies.
Schär, C., P.L. Vidale, D. Lüthi, C. Frei, C. Häberli, M. Liniger and C. Appenzeller (2004): The role of increasing temperature variability in European summer heat waves. Nature, 427, external pagedoi: 10.1038/nature02300
Seneviratne, S.I., D. Lüthi, M. Litschi, and C. Schär (2006): Land-atmosphere coupling and climate change in Europe. Nature, 443, external pagedoi: 10.1038/nature05095.
Frei, C., R. Schöll, S. Fukutome, J. Schmidli, and P. L. Vidale (2006), Future change of precipitation extremes in Europe: Intercomparison of scenarios from regional climate models, J. Geophys. Res., doi:external page10.1029/2005JD005965.
Fischer, E.M., S.I. Seneviratne, P.L. Vidale, D. Lüthi and C. Schär (2007): Soil moisture - atmosphere interactions during the 2003 European summer heat wave. J. Climate, 20, 20, 5081-5099, external pagedoi:10.1175/JCLI4288.1 .
Fischer, E.M., S. I. Seneviratne, D. Lüthi, and C. Schär (2007): Contribution of land-atmosphere coupling to recent European summer heat waves, Geophys. Res. Lett., external pagedoi:10.1029/2006GL029068 .
Fischer, E.M., C. Schär, 2009: Future changes in daily summer temperature variability: driving processes and role for temperature extremes, Clim. Dynam., external pagedoi: 10.1007/s00382-008-0473-8 .
Fischer, E.M., C. Schär (2010): Consistent geographical patterns of changes in high-impact European heatwaves, Nature Geoscience, external pagedoi: 10.1038/NGEO866.
Fischer, E.M., J Rajczak, and C. Schär (2012): Changes in European summer temperature variability revisited, Geophys. Res. Lett. Geophys., external pagedoi:10.1029/2012GL052730 .
Rajczak, J., P. Pall and C. Schär (2013): Projections of extreme precipitation events in regional climate simulations for Europe and the Alpine Region, J. Geophys. Res. Atmos., external pagedoi:10.1002/jgrd.50297 .
Schär, C., Ban, N., Fischer, E.M., Rajczak, J., Schmidli, S., Frei, C., Giorgi, F., Karl, T.R., Kendon, E.J., Klein Tank, A.M.G., O`Gorman, P.A., Sillmann, J., Zhang, X. and F.W. Zwiers (2016): Percentile indices for assessing changes in heavy precipitation events, Climatic Change, in revision